My last flagship project at University of Bonn began in the Winter of 2022/23. That semester, I selected the course, Effective Programming for Economists (taught by Dr. Janos Gabler), which delved into the various aspects of learning to think and write about code efficiently in Python. That this was likely my last course as a Master student, I was highly motivated to see just how far I could push myself from my comfort zone with Python using the technical skills we were fast learning in the course. I deliberated during the initial weeks on a topic that would be 1) an application of machine learning to a real-world problem and 2) be one that I could feasibly code and polish within the four-month timeline. During this time, I was a student assistant in the Institute of Environment and Human Security at United Nations in Bonn, and so I was also inspired to tackle problems related to advancing human welfare.
My surveying led me to some groundbreaking research from Stanford University that leverages deep learning along with high resolution daytime satellite imagery and nightlight data to quantify poverty in African countries. This paper aimed to address that a key challenge in tracking progress on poverty eradication goals is the unusual difficulty of obtaining administrative survey data in many regions most affected by poverty. This un-availability is due to the time-consuming and cost-prohibitive nature of conducting large-scale surveys. At the same time, any serious progress on poverty eradication goals necessitates that we are able track it in a timely and reliable manner. This paper used Convolutional Neural Networks (CNNs) to bridge this data gap by processing cheap and abundant sources of data as an alternative to household survey.
Setup
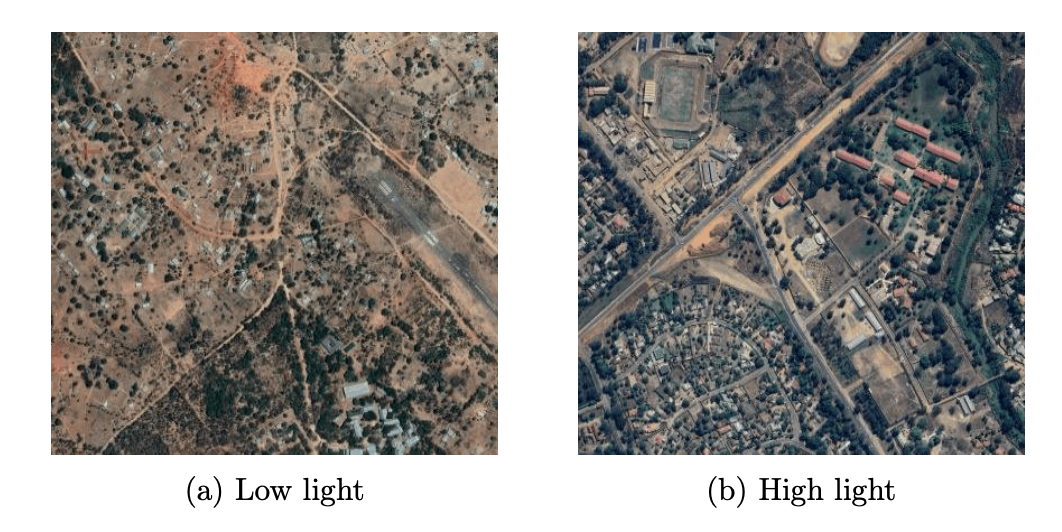
However, of course satellite imagery does not explicitly capture the vast differences in wealth between regions of a country. Therefore, transfer learning is deployed to help the model extract economically relevant features from thousands of unstructured satellite images. More specifically, higher nightlights intensity typically indicates a given region is more developed than a region with lower nightlights. This nightlight data can be used to extract landscape features in daytime imagery that are correlated with economic outcomes, such as roads, farmlands, waterways, roof, and urban areas. In the final step, the trained model can be used to predict village level wealth as measured by traditional surveys.
The contribution of my project was to create a seamless, reproducible workflow for the original study, to exemplify how unconventional forms of data can be easily integrated into economists’ research and programming pipelines. The layout of the original replication kit and related repositories on GitHub involved considerable work to obtain and manage the data and run several scripts in a particular order to produce the desired results. I felt this complexity may disincentivize the ability of new users to alter model parameters and build on the authors’ work. I ameliorated this issue by integrating all scripts and tasks in a coordinated ‘pytask‘ framework. In doing so, I utilized the CNN method to estimate consumption expenditure in Malawi and attempt to match the R2 from the authors’ model, with an emphasis on highlighting the several programming steps involved in such an analysis, from data collection to prediction.
Overview
My project’s CNN model training had the following structure which used nightlight data for predicting consumption:
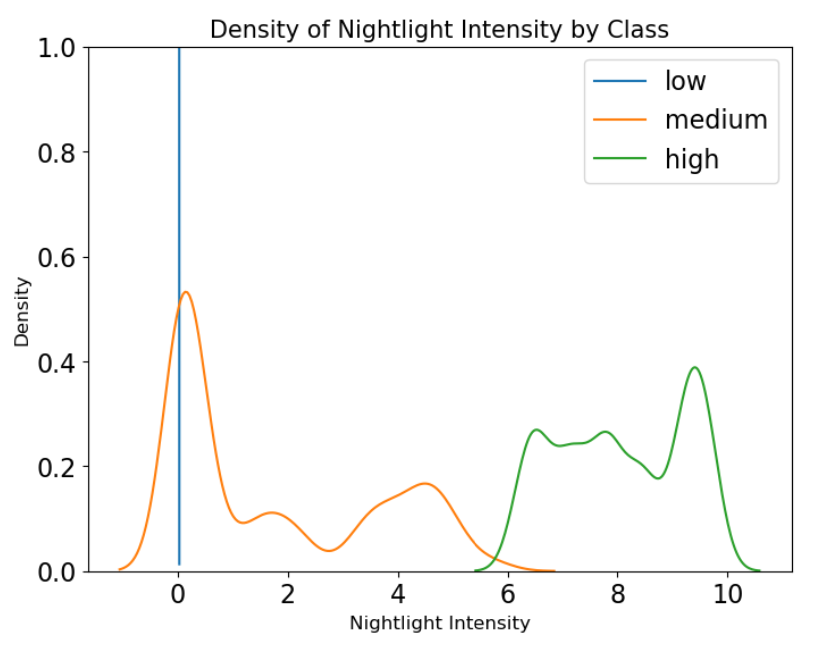
- Use Gaussian Mixture Model to separate satellite images into 3 nightlight classes (no, low, high).
- Train CNN to predict nightlight classes in the training set (80%) and compute model accuracy in validation set (20%)
- Use trained model to extract feature vector for each image in validation set by hooking model output just before the final classification step.
- Train ridge regression on the principal components of the feature matrix and generate predicted consumption in the validation set.
Although the technicalities of CNN are beyond the scope of such a blog post (for this I refer to the project’s full technical report if you’re interested!), I will briefly provide some intuition on transfer learning: nightlights were used as a proxy for economic activity and then the CNN model took as input thousands of satellite imagery and used that to predict variation in nightlight intensities.
This is a transfer learning strategy in which the model receives no human input that these images are in any way useful for predicting economic activity or estimating consumption expenditures; it only learns to identify those features in satellite images that are relevant for predicting nightlights. The output of this step is a trained model capable of reducing high-dimensional imagery inputs to low-dimensional features relevant for predicting the variation in nightlights.
Model Training
The training phase involved using a Gaussian Mixture Model to categorize the satellite images based on nightlight intensity. This categorization facilitated more focused training of the CNN, allowing it to predict poverty levels with higher accuracy. After training, the CNN was able to transform high-dimensional image data into feature vectors that effectively represented different poverty levels.
Here I drew on the Pytorch library which consists of a range of CNN model choices and used the finetuning functions written by Inkawhich (2022) for implementation. The code was modified so that the first 2 epochs perform fine-tuning - that is, updating all model parameters, and after that perform feature extraction where only the output layer weights are updated taking the pre-trained model parameters are given.
Machine Prediction and Results
The trained CNN model then extracted feature vectors for each image in the validation set. These vectors are just a nonlinear mapping of the input images to their vector representations and are ’hooked’ just before the classification step. The result is an n x p dimensional matrix, where n = 2296 (validation satellite images) and p = 4096, the feature vectors for each image. The images were grouped according to their household-clusters coordinates and aggregated at this level using the mean. This process reduces the original matrix to X, a 780 by 4096 feature matrix, and outcome Y a vector for consumption per capita. The goal is to use these features extracted from satellite images, instead of directly using nightlights, to predict consumption expenditure.
However, using such a high dimensional dataset for prediction can be time consuming and caused convergence issues when training certain ML models. Therefore, instead of using the entire feature matrix for training these models, I first performed dimensionality reduction guided by principal component (PC) analysis.
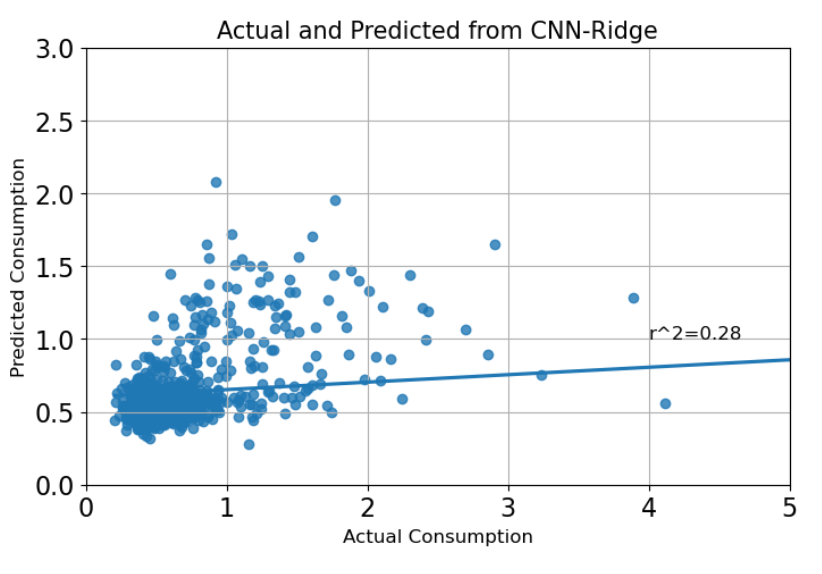
In general, ML models trained with CNN features data have a lower R2 compared to models trained with nightlight data using either 5-fold or 10-fold cross validation. Some models such as XGBoost perform poorly when trained on the nightlight data or CNN features data whereas Random Forest is improved using latter. Ridge Regression appears to be among the best performing models. Therefore, as a final illustration I plot the actual consumption values against values predicted by a cross-validated ridge regression using the first thirty PCs from CNN features data.
Conclusion and Reflection
The project not only demonstrated the potential of CNNs and satellite imagery to predict poverty but also highlighted the broader applicability of AI in socioeconomic research. By successfully mapping poverty in Malawi, I provided a reproducible template that can be replicated or adapted for other regions facing similar challenges.
The use of satellite imagery has opened up new avenues for using advanced technology to tackle some of the most pressing global issues. The integration of AI and satellite imagery in this context not only offers a more efficient alternative to traditional methods relying on household survey data but also enriches our understanding and approach to global development challenges.
References
Inkawhich, Nathan (2022). Finetuning Torchvision Models Kernel Description. url: https:// pytorch.org/tutorials/beginner/finetuning_torchvision_models_tutorial.html.
Jean, Neal, Marshall Burke, Michael Xie, W Matthew Davis, David B Lobell, and Stefano Ermon (2016). “Combining satellite imagery and machine learning to predict poverty”. In: Science 353.6301, pp. 790–794.